
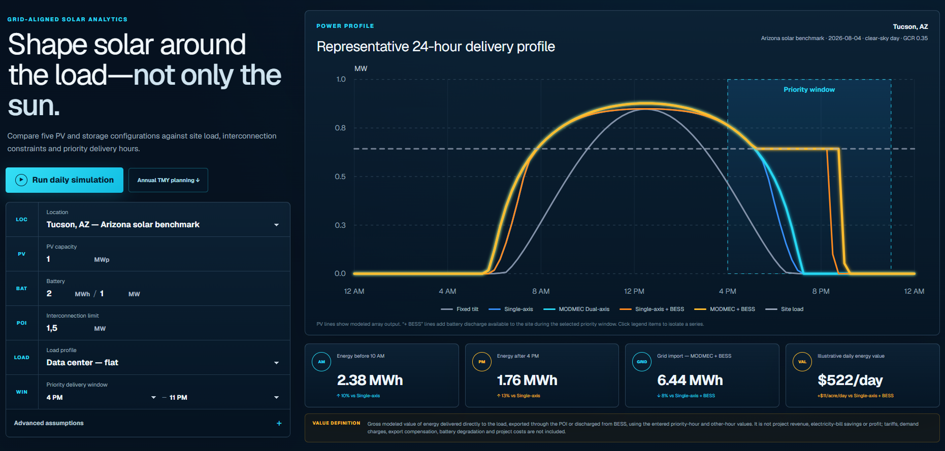
Solar can be a valuable part of a data center's energy portfolio. But a facility that operates continuously cannot evaluate a daytime resource through an annual total alone. The operating value appears in the hour-by-hour interaction between generation and demand.
Start with the load shape, not the annual bill.
In its 2026 outlook, the U.S. Energy Information Administration assumes that electricity demand from data-center servers is essentially flat across the hours of the day. EIA also models the cooling required to support those servers, which can add a weather-sensitive component to the facility profile.[2]
That does not mean every data center has a perfectly horizontal load curve. Cooling systems, utilization, maintenance, backup systems and the mix of training, inference and other compute tasks all matter. It does mean that a high, persistent baseline is a more useful starting point than the bell-shaped demand profile often associated with offices or retail buildings.
The scale of the load makes hourly fit consequential.
DOE reported that U.S. data centers consumed about 176 TWh in 2023—approximately 4.4% of national electricity use—and projected a range of 325–580 TWh by 2028, equivalent to roughly 6.7%–12% of U.S. consumption.[1] EIA's 2026 outlook likewise identifies data-center servers as a major driver of renewed electricity demand growth.[3]
For utilities and data-center operators, this is not simply an energy-procurement question. A large new load changes generation, transmission, distribution and reliability planning. The same annual MWh can create different infrastructure needs depending on whether demand and supply coincide or pull apart during critical hours.
Annual renewable matching and hourly operation are different products.
A company can procure enough renewable energy over a year to match its annual electricity use while still drawing from a different generation mix in individual hours. Google's stated 24/7 carbon-free-energy ambition makes this distinction explicit: the objective is carbon-free energy every hour, on each grid where it operates.[4]
Microsoft describes an hourly matching arrangement in Washington that combines hydro, solar and wind. Daytime renewable surplus can conserve water in hydro reservoirs, while energy is supplied back during hours when wind or solar are unavailable. The example is important because it is a portfolio solution—not a claim that one resource alone supplies an around-the-clock load.[8]
Three clocks should be modeled together.
A useful planning model places three hourly profiles on the same timeline:
- the load: IT demand, cooling and other facility consumption;
- the supply: the actual PV production envelope and other contracted or onsite resources; and
- the constraint: BESS power and energy limits, POI capacity, export rules and the hours in which grid supply is most constrained or valuable.
This view separates solar generation into operationally different destinations. Some energy reaches the load directly. Some can charge storage. Some may pass through the interconnection point, and some may be clipped or curtailed. After solar production falls, the remaining demand must come from BESS, the grid or another firm source.
A battery does not make the upstream PV profile irrelevant.
Storage is essential in many 24/7 clean-energy strategies, but its result depends on what it receives and when. Two PV configurations with the same annual production can send different quantities directly to the load, reach the battery at different hours and leave different states of charge before the evening priority window.
NREL has examined how flexible loads and storage can reshape building demand to improve onsite use of distributed PV.[9] The practical design question is therefore not "solar or storage?" It is which combination of PV profile, storage and controllable load produces the required outcome with acceptable cost, resilience and operating risk.
Demand flexibility belongs in the same model.
Treating the entire data-center load as immovable would also be too simple. Google has described shifting non-urgent compute tasks to hours with more lower-carbon electricity, using hourly forecasts for both grid carbon intensity and computing requirements.[5] DOE has separately called for better planning data on where and when data-center demand appears and how much temporal or spatial flexibility is genuinely available.[6]
Flexibility is not unlimited. Google notes that data-center demand response remains early, location-specific and constrained by the reliability requirements of critical services.[7] The strongest model therefore does not choose between shaping supply and shifting demand. It tests both, together with storage and grid supply.
A data-center solar scorecard.
Annual MWh and LCOE remain important, but an hourly comparison should add metrics that expose operating fit:
- solar energy delivered directly to the facility load;
- energy routed into and discharged from BESS;
- BESS state of charge before the required delivery window;
- total and maximum grid import;
- solar production before 10 AM and after 4 PM;
- utilization of the available point of interconnection;
- curtailment or clipping under the modeled constraints; and
- time-weighted energy value under explicit hourly assumptions.
These metrics do not produce one universal winner. The answer will change with location, tariff, reliability standard, workload, storage design and grid conditions. Their purpose is to make those differences visible before a project architecture is fixed.
The MODMEC hypothesis.
MODMEC is developing a row-based dual-axis tracker architecture and Smart Watts control layer around a specific hypothesis: a broader, more controllable solar production envelope may improve the fit between PV, a persistent load, storage and the interconnection point.
That hypothesis does not imply that dual-axis tracking can supply a data center through the night or eliminate the need for storage, firm generation, grid supply or load flexibility. It asks a narrower and testable question: can changing when solar energy arrives improve direct use, battery coordination or critical-hour delivery enough to create project value?
The public MODMEC simulator is a planning tool for exploring that question. Its outputs are illustrative—not measured performance, an engineering study, a tariff analysis or an investment forecast.