
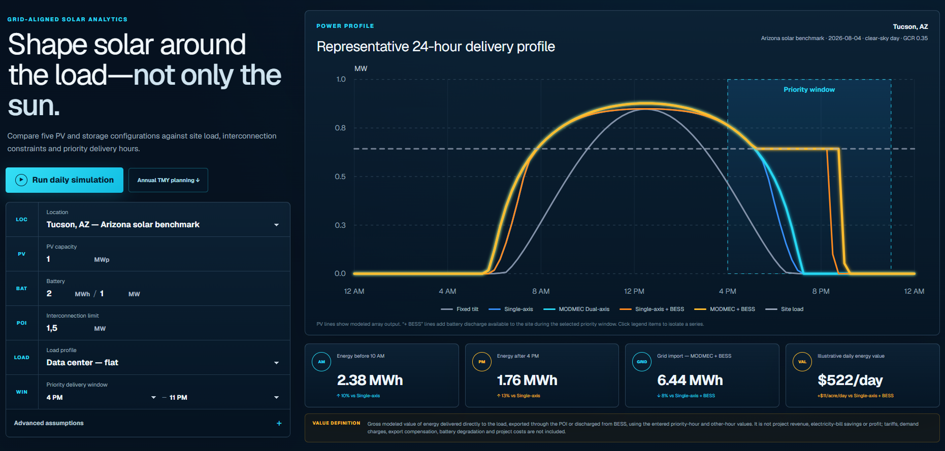
Solar projects have traditionally been compared through annual megawatt-hours, capacity factor and levelized cost. Those metrics remain useful. The problem begins when annual energy is treated as a complete description of project value.
The grid does not consume an annual total.
Electricity must be delivered through a system that continuously balances supply and demand.[7] A megawatt-hour delivered when local load is high, storage is empty and the grid can accept export does not create the same operating outcome as a megawatt-hour delivered into midday oversupply.
California ISO describes the practical consequence directly: abundant solar can exceed demand during parts of the day, requiring renewable generation to be reduced. This is not an argument against solar. It is an argument for measuring the shape of solar supply alongside its annual volume.[4]
Large loads make timing more important.
The U.S. Department of Energy reported that data centers accounted for about 4.4% of U.S. electricity consumption in 2023 and could reach approximately 6.7%–12% by 2028.[1] EIA’s 2026 outlook identifies data-center server demand as a major driver of renewed electricity growth and models server load as essentially flat throughout the day.[2][3]
A 24/7 facility therefore does not ask only, “How much solar can we procure in a year?” It also asks how much solar reaches the load directly, how much must be shifted through storage, and what residual grid demand remains during critical hours.
Corporate clean-energy accounting is moving in the same direction. Google’s 24/7 carbon-free-energy framework explicitly focuses on matching consumption with carbon-free supply every hour, not only balancing annual totals. Hourly matching is not yet the rule for every buyer, but it makes a previously hidden difference visible: generation timing matters.[6]
A battery does not erase the generation profile.
Storage can move solar energy to a more useful hour, but every shifted megawatt-hour interacts with power limits, energy capacity, round-trip losses, degradation and dispatch priorities. NREL’s storage work identifies time-shifting and capacity value as important sources of grid value. That does not mean a battery converts every PV profile into the same product at the same cost.[5]
A better starting profile can change how much energy enters the battery, when it must discharge and how much grid import remains. The appropriate question is therefore not “tracker or battery?” It is “what combination of PV shape and storage produces the required delivery profile with acceptable cost and risk?”
The interconnection point creates another clock.
A project may have excellent solar resource and still be constrained by the capacity of its point of interconnection, export rules or local load. When available PV exceeds the POI limit, the excess must serve onsite load, charge storage, be curtailed or find another permitted use. FERC’s interconnection framework also shows why connecting a project involves system studies, project readiness and potential network-upgrade impacts.[8]
Annual MWh alone cannot show whether the interconnection is used smoothly, whether short production peaks are repeatedly clipped, or whether more output is available during the hours in which the POI has headroom.
A more complete solar scorecard.
Annual generation should remain in the model, but it should sit beside metrics that describe operational fit:
- energy delivered before 10 AM and after 4 PM;
- energy supplied directly to the site load;
- energy routed through BESS and modeled battery cycles;
- maximum and total grid import;
- utilization of the available interconnection capacity;
- energy value under explicit hourly assumptions; and
- useful-energy value per acre where land is constrained.
None of these metrics is universally decisive. Their importance depends on the buyer, tariff, grid region, site and operating objective. That is precisely why a single annual number is no longer enough.
The MODMEC hypothesis.
MODMEC is developing a row-based dual-axis architecture and Smart Watts control layer around a testable hypothesis: changing the physical generation envelope may improve the fit between PV, load, BESS and the interconnection point.
This is not yet a bankable performance claim. The public simulator uses illustrative planning assumptions, and project outcomes require calibrated modeling, engineering and measured pilot data. The value of the simulator is that the hypothesis can be inspected rather than merely asserted.